Benchmark_QQQ · Benchmarks — strategy & live paper-trading performance
Benchmark_QQQ is a production algorithmic trading strategy paper-traded live from a $10,000 seed. Live paper-trading performance: 36.65% annualised …
Read Article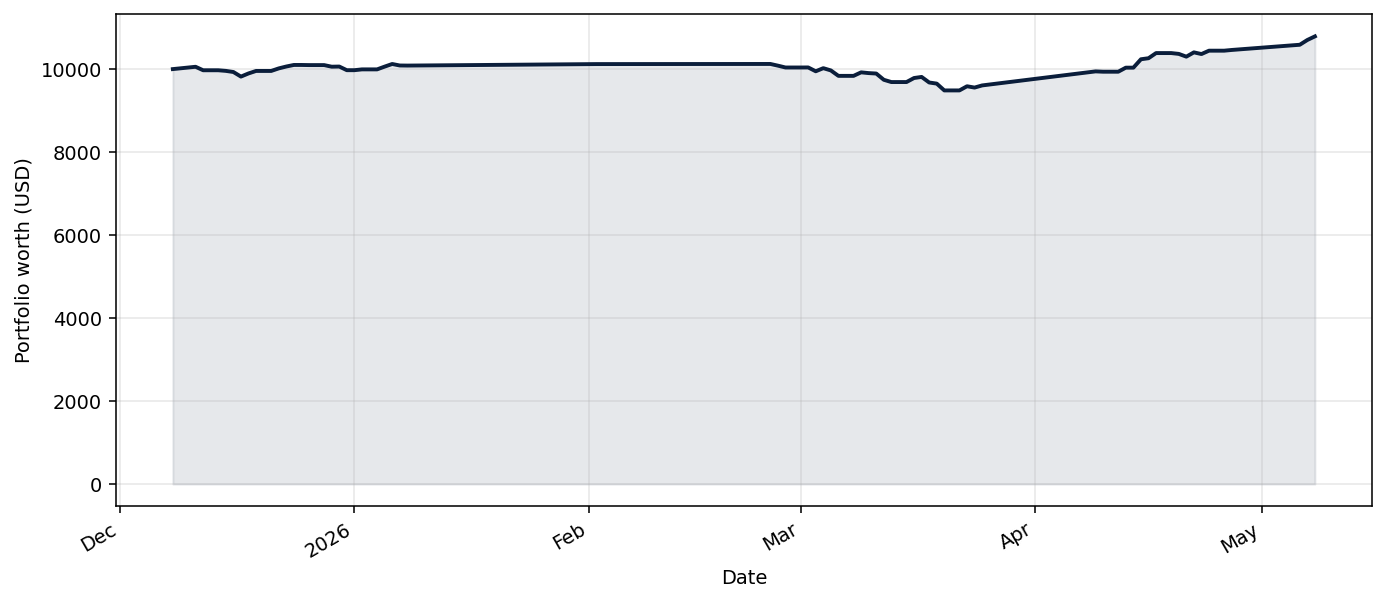
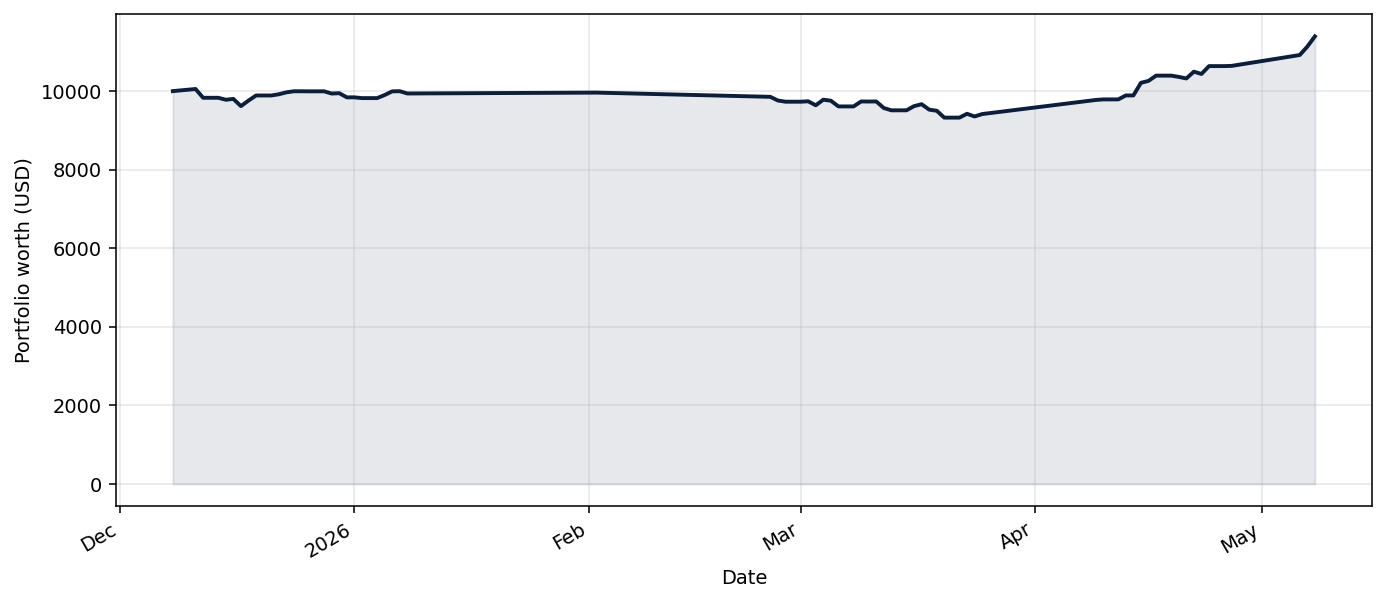
Benchmark_SPY is a production algorithmic trading strategy paper-traded live from a $10,000 seed. Live paper-trading performance: 17.19% annualised return (8.88% total), Sharpe 1.51 over 127 days.
See the full chart, current holdings, and historical backtest on the strategy’s live page →.
A full technical writeup for Benchmark_SPY is in progress. In the meantime:
Benchmark_SPY is part of the open-source python_tradingbot_framework — fork the repo, run the code locally, or deploy your own variant. The live page shows today’s portfolio state alongside the full historical backtest.
Since deployment, Benchmark_SPY has produced an annualised return (CAGR) of 17.19% on a $10,000 paper seed (8.88% cumulative), with a Sharpe ratio of 1.51 and a max drawdown of -6.30% over 127 trading days. Numbers refresh daily on the live page.
Yes. Benchmark_SPY is part of the open-source python_tradingbot_framework — you can fork the repo, inspect the strategy, and run the code locally or on your own Kubernetes cluster.
Benchmark_SPY belongs to the Benchmarks family. Buy-and-hold benchmarks (SPY, QQQ, FTWD) for a fair comparison baseline. Browse the full leaderboard to compare it against strategies from other families.
Browse the full live leaderboard to see how Benchmark_SPY ranks against 23 other paper-traded strategies, all seeded with the same $10,000.
Benchmark_QQQ is a production algorithmic trading strategy paper-traded live from a $10,000 seed. Live paper-trading performance: 36.65% annualised …
Read Article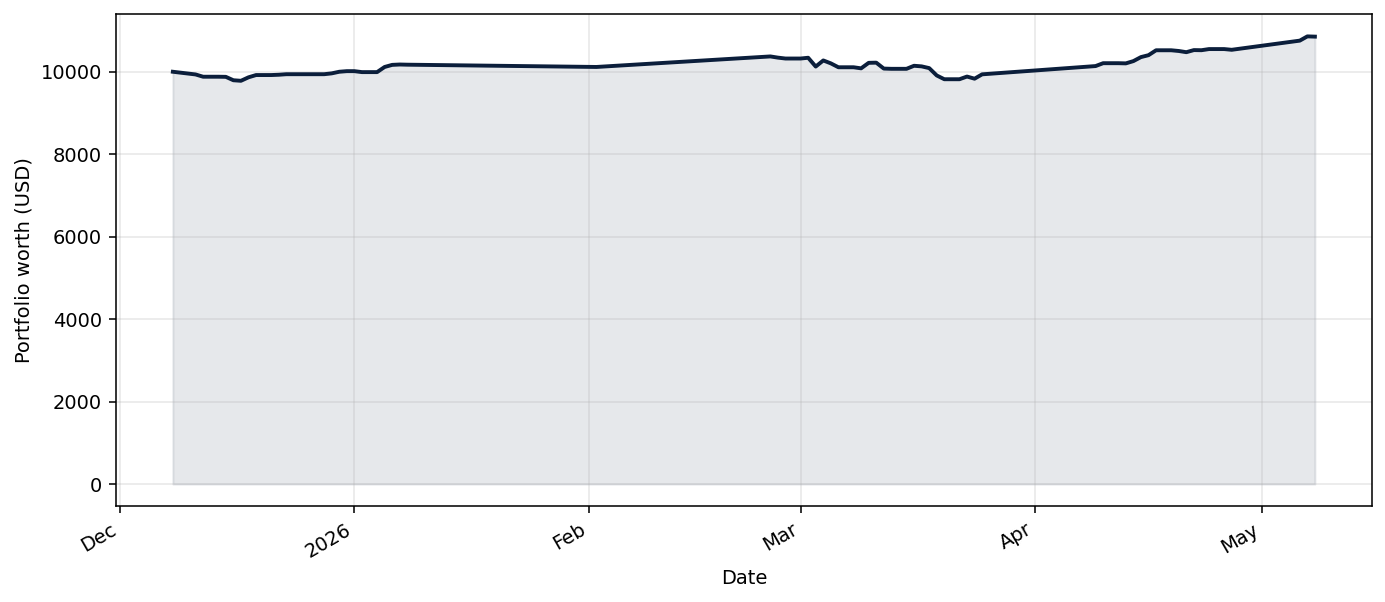
Benchmark_FTWD is a production algorithmic trading strategy paper-traded live from a $10,000 seed. Live paper-trading performance: 26.52% annualised …
Read Article