
19% p.a.
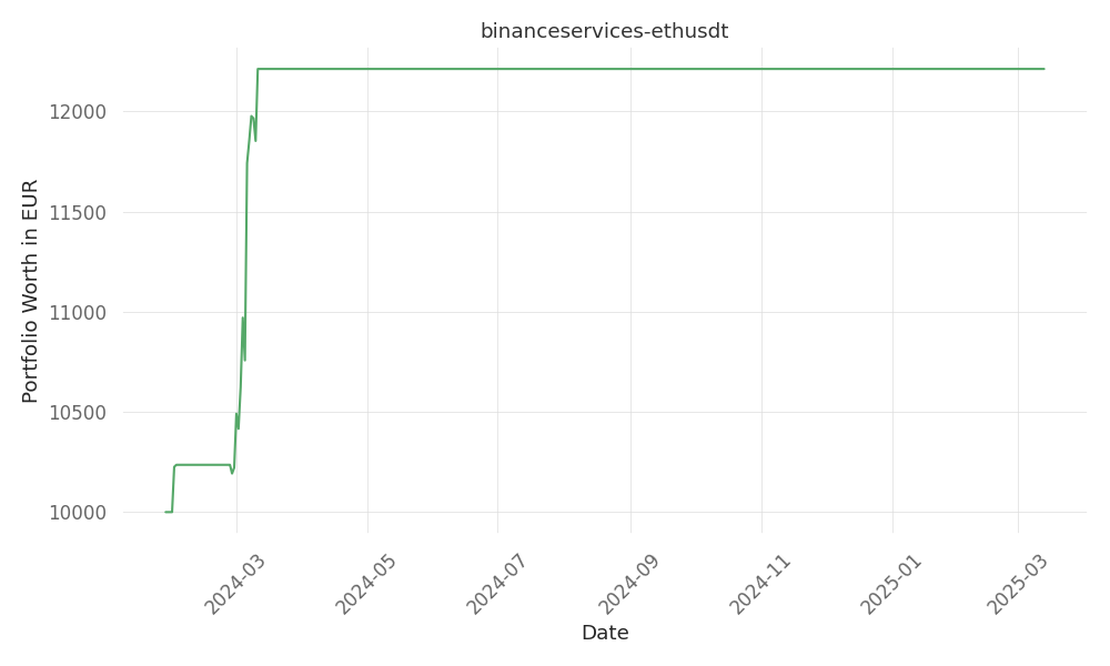
binanceservices-ethusdt
Introduction to our strategy no description yet Quick Summary Metric Value Return % p.a. 19 Days active 410 …


source: Benzinga
| ticker | polarity | why? |
|---|---|---|
| TSM | positively | The mixed options activity, with notable bullish trades, suggests that some investors remain optimistic about Taiwan Semiconductor’s (TSM) future despite the overall bearish sentiment. Significant乐emphasized investment in both puts and calls indicates high interest and volatility, potentially driving up the stock price. |
| NVDA | positively | NVIDIA (NVDA) is highly dependent on Taiwan Semiconductor Manufacturing Co. Ltd (TSM) for its chip manufacturing. If there is a decrease in demand for TSM because of options traders going bearish on it could have big ripple effects for NVIDIA, due to its sales depending partly on the output from TSM’s factories. |
finnhub-recommendations , static-skfolio-denoised-cov-shrunk-expret , newstrader , c-bigtech-momentum , xgb_sharpeopt_trenddet , randombot , static-skfolio-max-sortino , bt_headshoulder_sharpeopt_mixed
Investors with significant capital have adopted a bearish stance on Taiwan Semiconductor Manufacturing Co. Ltd. (TSM), as evidenced by unusual options activity detected today. This data, sourced from publicly available options history, indicates substantial trading volume that warrants attention. The options trades, spotted by our scanner, reveal a mix of sentiments, with 33% bullish and 44% bearish. Out of the notable trades, 4 are puts totaling $264,322, and 5 are calls amounting to $254,678. This activity suggests a significant interest in both directions, but the bearish sentiment slightly edges out the bullish. The significant investors appear to be targeting a price range from $177.5 to $230.0 for Taiwan Semiconductor over the recent months. This price target range indicates a mixed outlook, with some traders expecting a downside move while others remain optimistic about future price movements. As of today, the average open interest for TSM options stands at 5,983.22, with a total volume of 1,815.00. The chart below shows the progression of both call and put option volume and open interest for high-value trades in TSM, situating within the strike price corridor from $177.5 to $230.0, over the past 30 days. Over the past 30 days, there have been significant options trades detected: | Symbol | PUT/CALL | Ask | Bid | Price | Strike Price | Trade Price | Open Interest | Volume | |–|-|-|-|–|–|-||| | TSM | PUT | $6.75 | $6.65 | $6.65 | $180.00 | $108,300 | 9.8K | 421 | | TSM | PUT | $24.95| $24.90| $24.95 | $185.00 | $84,800 | 121 | 43 | | TSM | CALL | $5.20 | $5.05 | $5.10 | $185.00 | $70,300 | 658 | 198 | | TSM | CALL | $4.10 | $4.00 | $4.00 | $190.00 | $65,200 | 6.4K | 707 | | TSM | CALL | $10.95| $10.85| $10.85 | $185.00 | $54,200 | 16.0K | 40 | Taiwan Semiconductor Manufacturing Co. is the world’s largest dedicated chip foundry, with over 60% market share. Founded in 1987, TSMC has a strong customer base including Apple, AMD, and Nvidia. The company’s scale and high-quality technology enable it to generate solid operating margins, despite the highly competitive foundry business.
Taiwan Semiconductor Manufacturing Co. Ltd. (TSM) has seen a 1.87% increase in stock price, reaching $183.36 with a trading volume of 8,086,561. The RSI indicators suggest that the stock may be nearing oversold territory. The next earnings report is expected in 43 days. In the last month, 1 expert released a rating on TSMC with an average target price of $225.0.
Introduction to our strategy no description yet Quick Summary Metric Value Return % p.a. 19 Days active 410 …

Introduction to our strategy no description yet Quick Summary Metric Value Return % p.a. -85 Days active 427 …

Introduction to our strategy no description yet Quick Summary Metric Value Return % p.a. -60 Days active 408 …