Investment thesis
Regime-adaptive — economic intuition. Financial time series alternate between trending and mean-reverting regimes. A single static strategy is structurally mis-specified in at least one regime. This family detects the regime and switches logic, monetising regime-transition risk that pure trend or pure mean-reversion books leave on the table.
Risk-adjusted performance — live track record
Forward-tested daily against live market data. Metrics derived from end-of-day portfolio marks; methodology documented on the Due Diligence and About pages.
| Return | Value | Risk-adjusted | Value | |
|---|---|---|---|---|
| Current portfolio worth | $12184.68 | Sharpe ratio | 2.25 | |
| Total return | 21.85% | Sortino ratio | 2.56 | |
| CAGR | 48.35% | Calmar ratio | 6.88 | |
| Volatility (annualised) | 19.09% | Profit factor | 1.61 | |
| Days live | 122 | Maximum drawdown | -7.03% |
Process consistency
| Positive months | 50.0% |
| Best month | 11.13% |
| Worst month | -1.78% |
| Recovery from max drawdown | still underwater |
Market independence and alpha
Measured against every benchmark over the strategy’s own live window. Alpha is annualised Jensen’s alpha (the return not explained by benchmark exposure, assuming a zero risk-free rate); t is its t-statistic.
| Benchmark | Correlation | 90-day rolling correlation | Beta | Alpha (ann.) | t |
|---|---|---|---|---|---|
| SPY | 0.78 | 0.84 | 1.20 | -1.87% | -0.11 n.s. |
| QQQ | 0.96 | 1.00 | 0.92 | -5.36% | -0.70 n.s. |
| FTWD | 0.56 | 0.55 | 1.03 | +7.92% | 0.35 n.s. |
| GLD | 0.27 | 0.31 | 0.22 | +44.17% | 1.66 n.s. |
| BTC | 0.08 | 0.02 | 0.03 | +40.96% | 1.49 n.s. |
Correlation materially below 1.0 to all benchmarks indicates returns that are not a re-expression of long equity beta — a strategy tracking one index closely while showing low correlation to another is not diversifying, only rotating.
Closest benchmark: QQQ (correlation 0.96). Alpha against it is -5.36% annualised but not statistically significant (|t| = -0.70 < 2), meaning it cannot be distinguished from zero at this sample size.
Trading activity
Ratios computed over calendar days understate strategies that hold cash and overstate those that simply trade rarely, so exposure is disclosed directly.
| Lifetime executed trades | 1 |
| Days with no position change | 35.5% |
| Sortino over active days only | 3.19 |
Note: with 1 executed trade this track record reflects a held position, not an active strategy. Its risk-adjusted ratios are driven mainly by the underlying asset’s path and time out of the market.
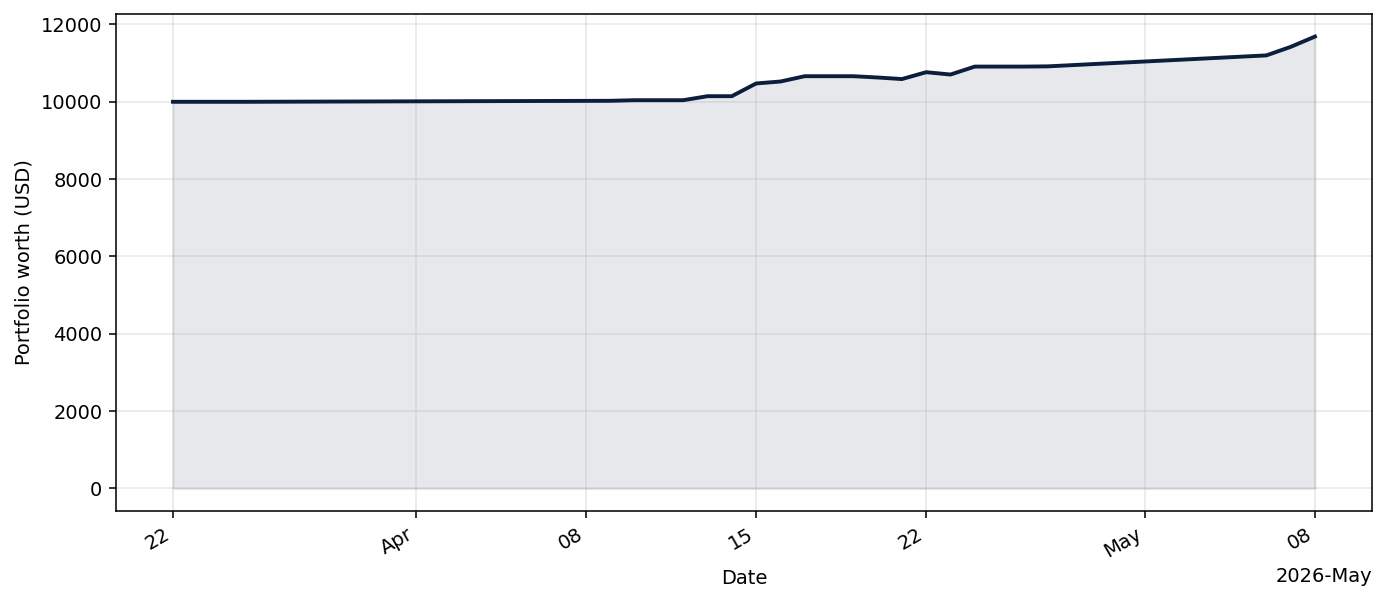
Equity curve
Live track record — forward-tested performance from the strategy's production start date.
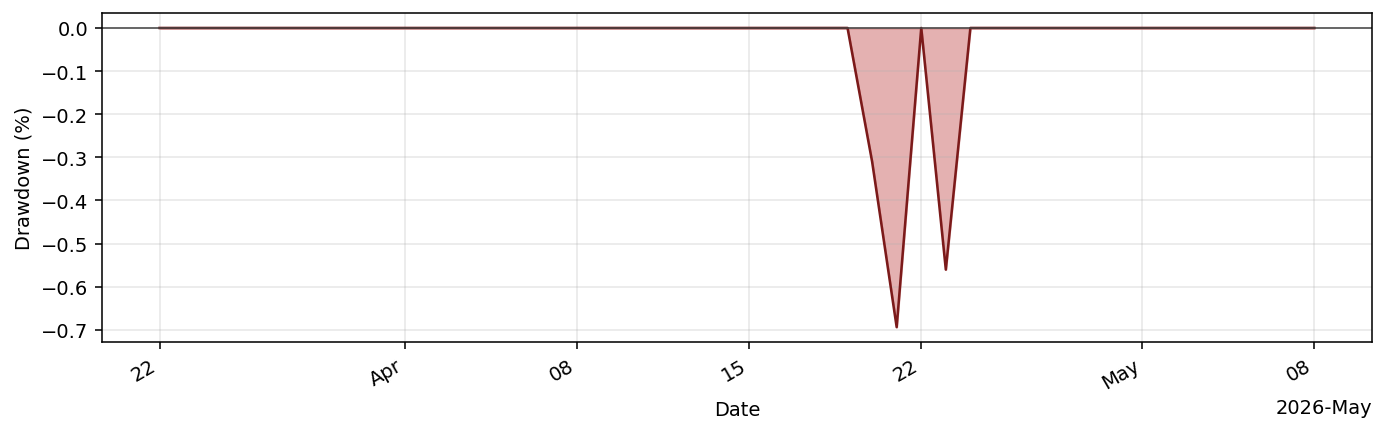
Drawdown profile
Underwater curve — percentage below the running high-water mark. Institutional allocators read this before the equity curve.
Current holdings
| Symbol | Quantity |
|---|---|
| QQQ | 16.4336 |
| USD | 0.0000 |
Research & documentation
- Strategy deep-dive: AdaptiveMeanReversionBot: strategy deep-dive & live performance
- Methodology write-up: AdaptiveMeanReversionBot
- Reference implementation:
tradingbot/adaptivemeanreversionbot.py - Framework: python_tradingbot_framework (open source, fully inspectable)
Related strategies
Other strategies in the Regime-adaptive family:
- RegimeAdaptiveBot · research note- TARegimeAdaptiveBot · research note Or view the full strategy roster.
For professional investors
Request the investor deck, DDQ, and extended analytics. Firm-gated and reviewed manually.
Request access