Investment thesis
Benchmarks — economic intuition. Passive buy-and-hold references (SPY, QQQ, FTWD). Included for side-by-side comparison so every active strategy can be evaluated against the investable beta it seeks to outperform.
Risk-adjusted performance — live track record
Forward-tested daily against live market data. Metrics derived from end-of-day portfolio marks; methodology documented on the Due Diligence and About pages.
| Return | Value | Risk-adjusted | Value | |
|---|---|---|---|---|
| Current portfolio worth | $11824.31 | Sharpe ratio | 1.94 | |
| Total return | 18.24% | Sortino ratio | 2.48 | |
| CAGR | 36.65% | Calmar ratio | 5.06 | |
| Volatility (annualised) | 18.08% | Profit factor | 1.50 | |
| Days live | 127 | Maximum drawdown | -7.25% |
Process consistency
| Positive months | 50.0% |
| Best month | 13.02% |
| Worst month | -3.23% |
| Recovery from max drawdown | 26 days |
Market independence
Correlation and beta versus passive benchmarks, computed over the full live series.
| Benchmark | Correlation | 90-day rolling correlation | Beta |
|---|---|---|---|
| S&P 500 (SPY) | 0.84 | 0.00 | 1.44 |
| Bitcoin (BTC-USD) | 0.29 | 0.35 | 0.16 |
A correlation materially below 1.0 to both benchmarks indicates the strategy’s returns are not a simple re-expression of long equity or long crypto beta.
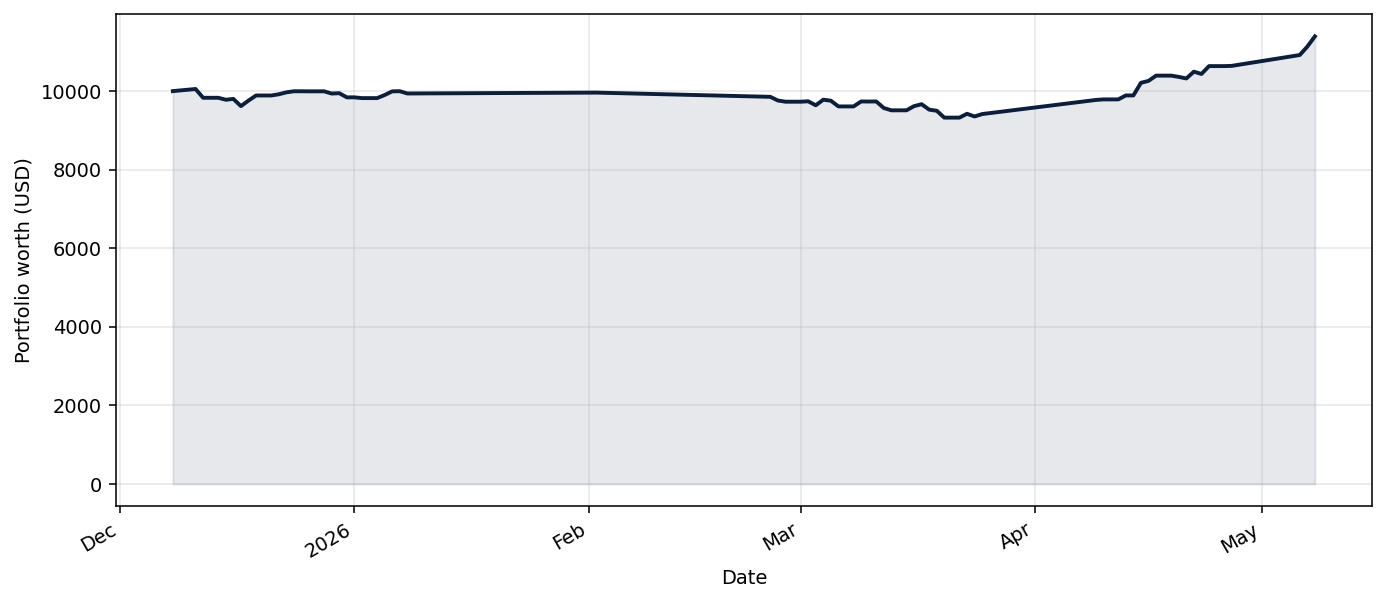
Equity curve
Live track record — forward-tested performance from the strategy's production start date.
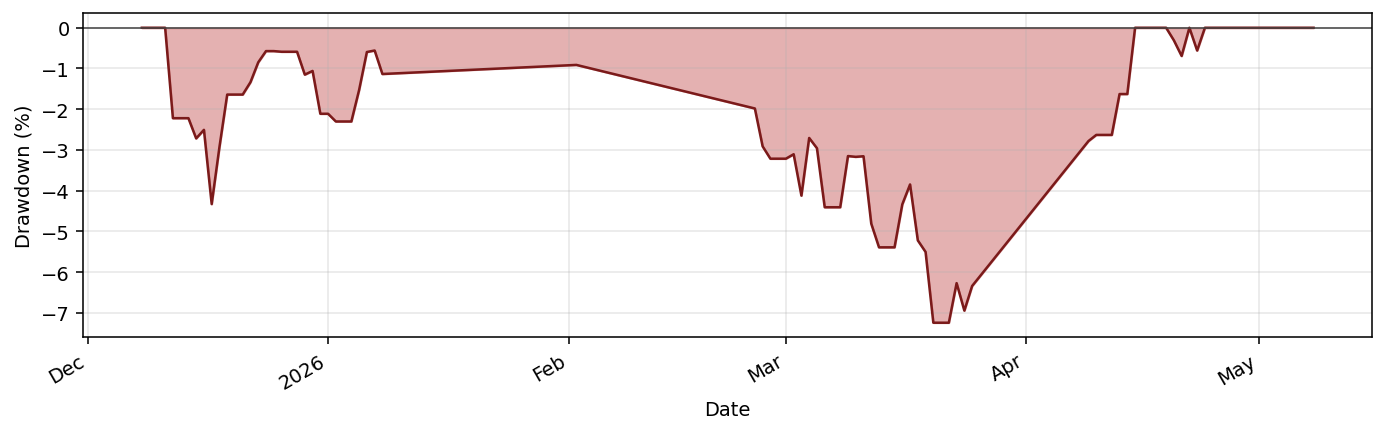
Drawdown profile
Underwater curve — percentage below the running high-water mark. Institutional allocators read this before the equity curve.
Current holdings
| Symbol | Quantity |
|---|---|
| QQQ | 16.0210 |
| USD | 0.0000 |
Research & documentation
- Strategy deep-dive: Benchmark_QQQ: strategy deep-dive & live performance
- Framework: python_tradingbot_framework (open source, fully inspectable)
Related strategies
Other strategies in the Benchmarks family:
- Benchmark_SPY · research note- Benchmark_FTWD · research note Or view the full strategy roster.
For professional investors
Request the investor deck, DDQ, and extended analytics. Firm-gated and reviewed manually.
Request access