Investment thesis
Event-driven — economic intuition. Discrete corporate and flow events (earnings, insider filings, curated signal feeds) produce information shocks with measurable post-event drift. Thesis: participants cannot fully price the event in real time due to regulatory lag, analyst revision cycles, and execution frictions — a structural rather than behavioural premium.
Risk-adjusted performance — live track record
Forward-tested daily against live market data. Metrics derived from end-of-day portfolio marks; methodology documented on the Due Diligence and About pages.
| Return | Value | Risk-adjusted | Value | |
|---|---|---|---|---|
| Current portfolio worth | $10402.59 | Sharpe ratio | 0.85 | |
| Total return | 4.45% | Sortino ratio | 1.33 | |
| CAGR | 14.57% | Calmar ratio | 3.01 | |
| Volatility (annualised) | 14.96% | Profit factor | 1.19 | |
| Days live | 96 | Maximum drawdown | -4.84% |
Process consistency
| Positive months | 50.0% |
| Best month | 6.08% |
| Worst month | -3.61% |
| Recovery from max drawdown | 24 days |
Market independence
Correlation and beta versus passive benchmarks, computed over the full live series.
| Benchmark | Correlation | 90-day rolling correlation | Beta |
|---|---|---|---|
| S&P 500 (SPY) | 0.58 | 0.00 | 0.77 |
| Bitcoin (BTC-USD) | 0.32 | 0.32 | 0.14 |
A correlation materially below 1.0 to both benchmarks indicates the strategy’s returns are not a simple re-expression of long equity or long crypto beta.
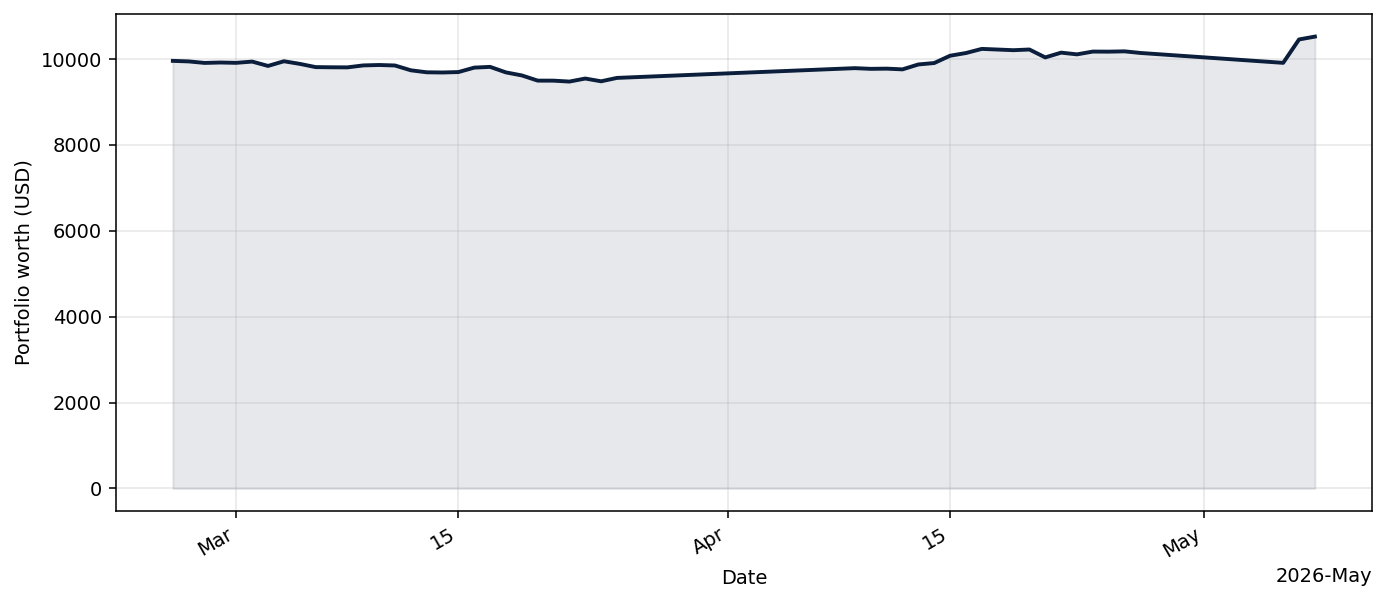
Equity curve
Live track record — forward-tested performance from the strategy's production start date.
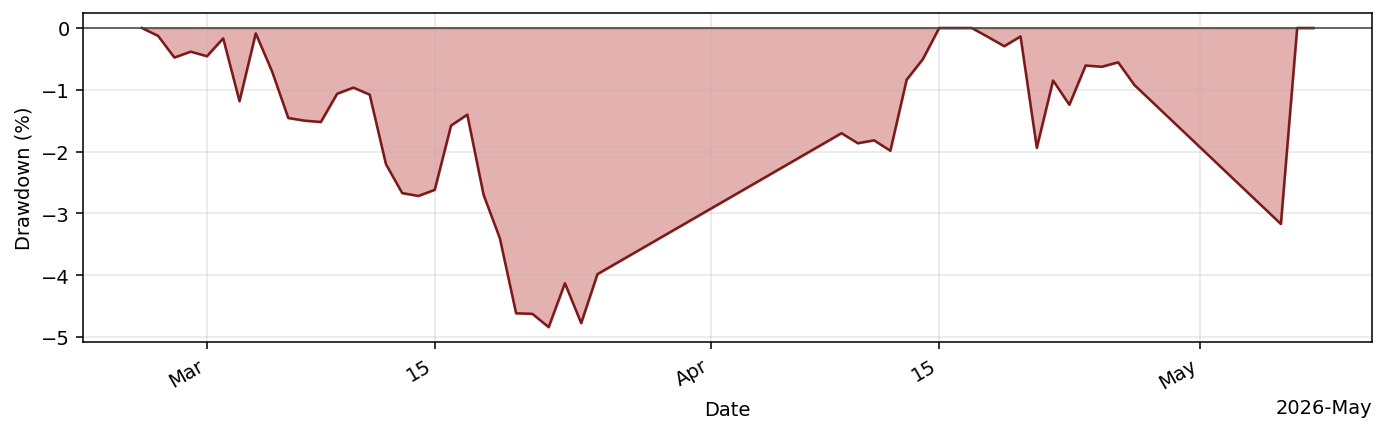
Drawdown profile
Underwater curve — percentage below the running high-water mark. Institutional allocators read this before the equity curve.
Current holdings
| Symbol | Quantity |
|---|---|
| 2B76.DE | 8.8108 |
| AAPL | 0.7129 |
| ADBE | 0.8263 |
| AMD | 0.4117 |
| AMZN | 0.8879 |
| AVAX-USD | 24.0253 |
| BNXG.DE | 0.9498 |
| BSV | 2.0885 |
| BTC-USD | 0.0025 |
| BTEC.L | 18.3089 |
| DBA | 4.2505 |
| DBB | 4.4994 |
| DBE | 4.1430 |
| DBMF | 5.2859 |
| DBO | 6.0415 |
| DG | 1.9397 |
| EEM | 2.3647 |
| ETH-USD | 0.0933 |
| FAS | 1.0773 |
| FNDX | 3.6616 |
| GLD | 0.5424 |
| GOOG | 0.5823 |
| IWDA.AS | 1.3067 |
| KDP | 6.8249 |
| L0CK.DE | 16.4037 |
| LLY | 0.1896 |
| META | 0.2858 |
| MSFT | 0.5564 |
| NOC | 0.2949 |
| NTSX | 2.7698 |
| NVDA | 1.0300 |
| PGR | 0.7934 |
| PYPL | 3.8530 |
| QQQ | 0.2245 |
| RENW.DE | 10.1167 |
| RWL | 0.8856 |
| SHV | 1.0301 |
| SQQQ | 4.0993 |
| TEAM | 2.4985 |
| TMF | 4.5198 |
| TQQQ | 2.0931 |
| TSLA | 0.5319 |
| UNH | 0.4059 |
| UPRO | 1.1691 |
| URA | 2.4092 |
| URTH | 0.8071 |
| USD | 0.0000 |
| UUP | 5.7538 |
| VAW | 0.6913 |
| VCR | 0.2933 |
| VDC | 0.7146 |
| VDE | 1.0511 |
| VFH | 1.2249 |
| VGT | 1.3868 |
| VHT | 0.5751 |
| VIS | 0.4634 |
| VLUE | 0.5779 |
| VNQ | 1.6963 |
| VOX | 0.8742 |
| VPU | 0.8389 |
| VTV | 0.5292 |
| W1TA.DE | 3.2215 |
| WM | 0.7513 |
| WOOD | 1.7050 |
| XAIX.DE | 0.7748 |
Research & documentation
- Strategy deep-dive: EarningsInsiderTiltBot: strategy deep-dive & live performance
- Reference implementation:
tradingbot/earningsinsidertiltbot.py - Framework: python_tradingbot_framework (open source, fully inspectable)
Related strategies
Other strategies in the Event-driven family:
- TelegramSignalsBankBot · research note Or view the full strategy roster.
For professional investors
Request the investor deck, DDQ, and extended analytics. Firm-gated and reviewed manually.
Request access