Investment thesis
Momentum & swing — economic intuition. Cross-sectional and time-series momentum are among the most documented anomalies in empirical asset pricing (Jegadeesh-Titman, Asness et al.). The thesis: investors under-react to gradual information and over-react late, leaving a multi-day window where recent winners continue. Squeeze and volatility-compression variants add a regime filter to reduce drawdowns in choppy markets.
Risk-adjusted performance — live track record
Forward-tested daily against live market data. Metrics derived from end-of-day portfolio marks; methodology documented on the Due Diligence and About pages.
| Return | Value | Risk-adjusted | Value | |
|---|---|---|---|---|
| Current portfolio worth | $10171.17 | Sharpe ratio | 0.67 | |
| Total return | 1.71% | Sortino ratio | 0.75 | |
| CAGR | 3.45% | Calmar ratio | 1.43 | |
| Volatility (annualised) | 5.52% | Profit factor | 1.15 | |
| Days live | 122 | Maximum drawdown | -2.41% |
Process consistency
| Positive months | 66.7% |
| Best month | 1.93% |
| Worst month | -1.31% |
| Recovery from max drawdown | 64 days |
Market independence and alpha
Measured against every benchmark over the strategy’s own live window. Alpha is annualised Jensen’s alpha (the return not explained by benchmark exposure, assuming a zero risk-free rate); t is its t-statistic.
| Benchmark | Correlation | 90-day rolling correlation | Beta | Alpha (ann.) | t |
|---|---|---|---|---|---|
| SPY | 0.80 | 0.87 | 0.36 | -9.64% | -2.02 |
| QQQ | 0.70 | 0.73 | 0.20 | -6.58% | -1.16 n.s. |
| FTWD | 0.43 | 0.42 | 0.23 | -4.14% | -0.57 n.s. |
| GLD | 0.64 | 0.65 | 0.16 | +4.51% | 0.74 n.s. |
| BTC | 0.11 | 0.10 | 0.01 | +2.89% | 0.37 n.s. |
Correlation materially below 1.0 to all benchmarks indicates returns that are not a re-expression of long equity beta — a strategy tracking one index closely while showing low correlation to another is not diversifying, only rotating.
Closest benchmark: SPY (correlation 0.80). Alpha against it is -9.64% annualised, statistically significant at |t| ≥ 2.
Trading activity
Ratios computed over calendar days understate strategies that hold cash and overstate those that simply trade rarely, so exposure is disclosed directly.
| Lifetime executed trades | 15 |
| Days with no position change | 33.1% |
| Sortino over active days only | 0.92 |
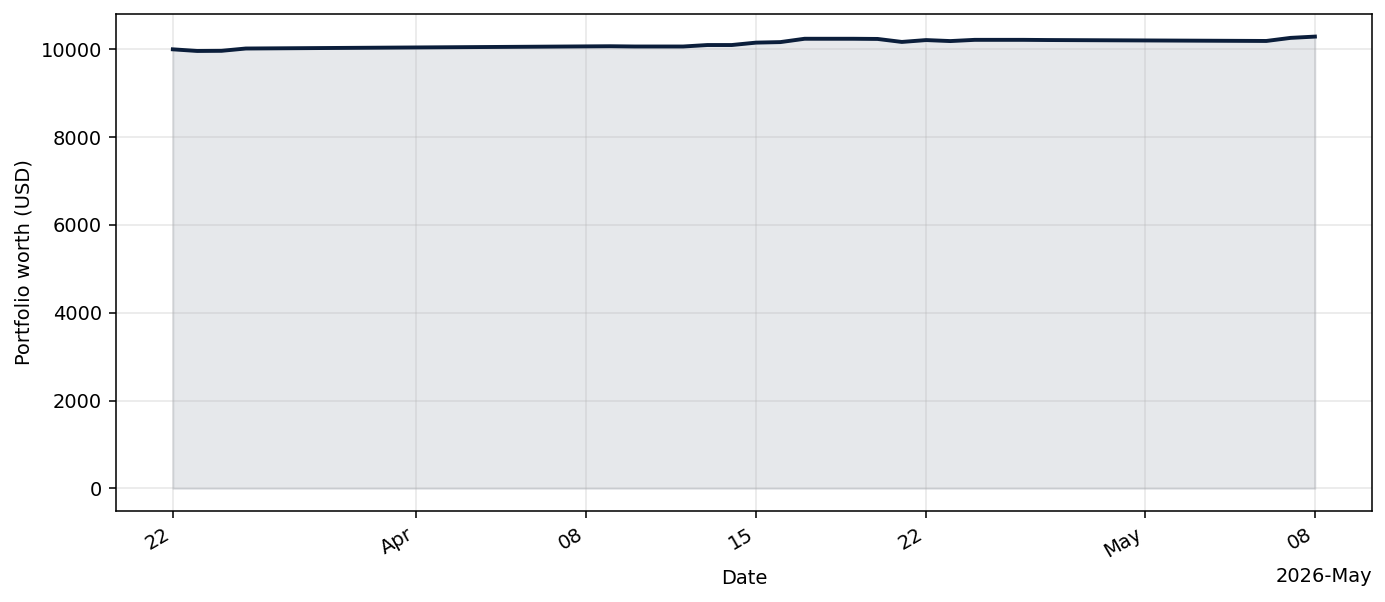
Equity curve
Live track record — forward-tested performance from the strategy's production start date.
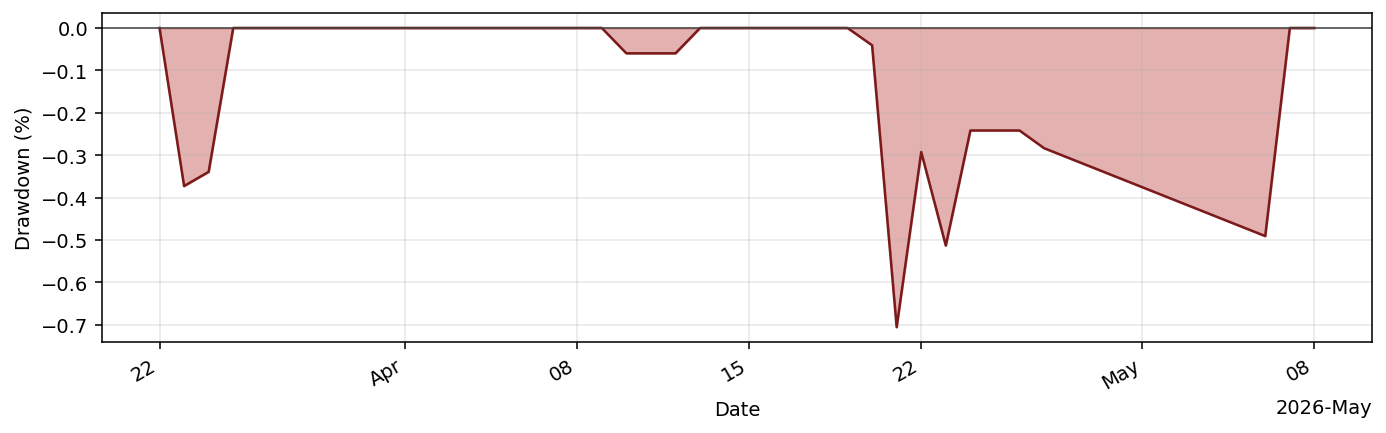
Drawdown profile
Underwater curve — percentage below the running high-water mark. Institutional allocators read this before the equity curve.
Current holdings
| Symbol | Quantity |
|---|---|
| IJS | 14.1342 |
| USD | 6413.1535 |
| VTI | 4.9926 |
Research & documentation
- Strategy deep-dive: GoldenButterflyMomBot: strategy deep-dive & live performance
- Reference implementation:
tradingbot/goldenbutterflymombot.py - Framework: python_tradingbot_framework (open source, fully inspectable)
Related strategies
Other strategies in the Momentum & swing family:
- SqueezeMomentumBot · research note- SwingTitaniumBot · research note Or view the full strategy roster.
For professional investors
Request the investor deck, DDQ, and extended analytics. Firm-gated and reviewed manually.
Request access