Investment thesis
Portfolio optimisation — economic intuition. Given a universe of imperfectly-correlated return streams, convex optimisation (Markowitz, risk-parity, recursive decay) produces weights that dominate naive equal-weight on a risk-adjusted basis. The edge is not in alpha discovery but in the disciplined combination of existing signals — consistent with institutional multi-manager allocation.
Risk-adjusted performance — live track record
Forward-tested daily against live market data. Metrics derived from end-of-day portfolio marks; methodology documented on the Due Diligence and About pages.
| Return | Value | Risk-adjusted | Value | |
|---|---|---|---|---|
| Current portfolio worth | $13715.33 | Sharpe ratio | 2.35 | |
| Total return | 37.15% | Sortino ratio | 2.24 | |
| CAGR | 250.53% | Calmar ratio | 12.16 | |
| Volatility (annualised) | 54.82% | Profit factor | 1.75 | |
| Days live | 71 | Maximum drawdown | -20.60% |
Process consistency
| Positive months | 66.7% |
| Best month | 34.96% |
| Worst month | -2.32% |
| Recovery from max drawdown | still underwater |
Market independence
Correlation and beta versus passive benchmarks, computed over the full live series.
| Benchmark | Correlation | 90-day rolling correlation | Beta |
|---|---|---|---|
| S&P 500 (SPY) | 0.79 | 0.00 | 3.90 |
| Bitcoin (BTC-USD) | 0.20 | 0.00 | 0.34 |
A correlation materially below 1.0 to both benchmarks indicates the strategy’s returns are not a simple re-expression of long equity or long crypto beta.
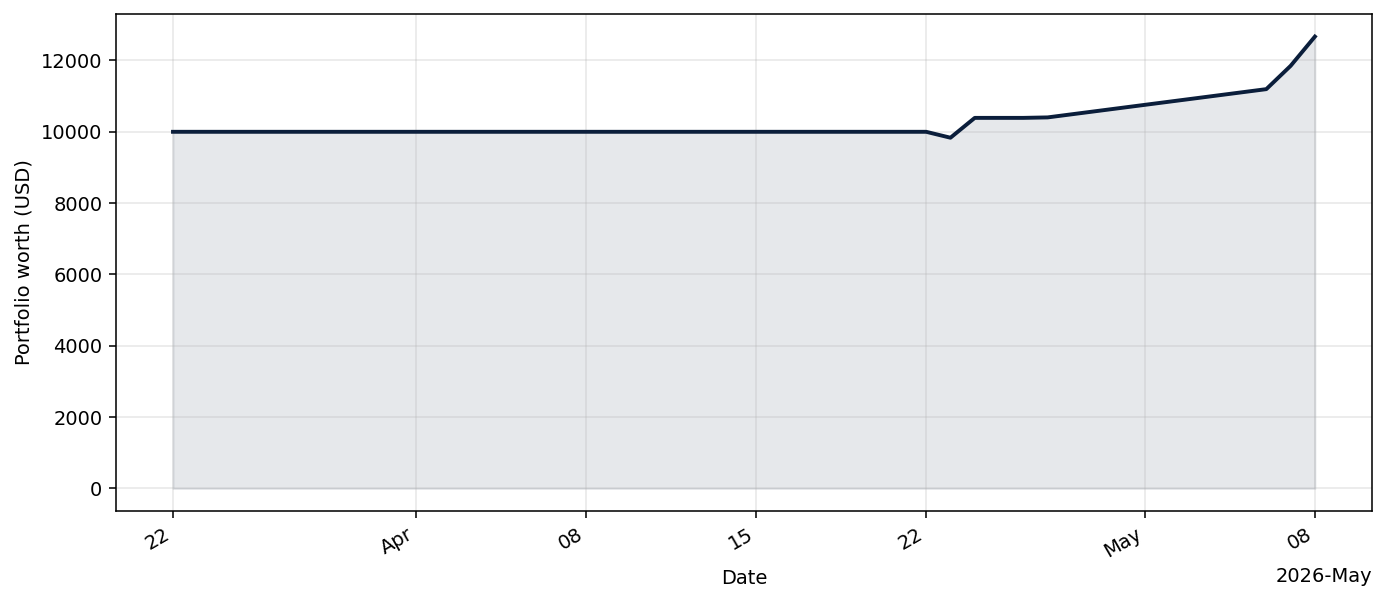
Equity curve
Live track record — forward-tested performance from the strategy's production start date.
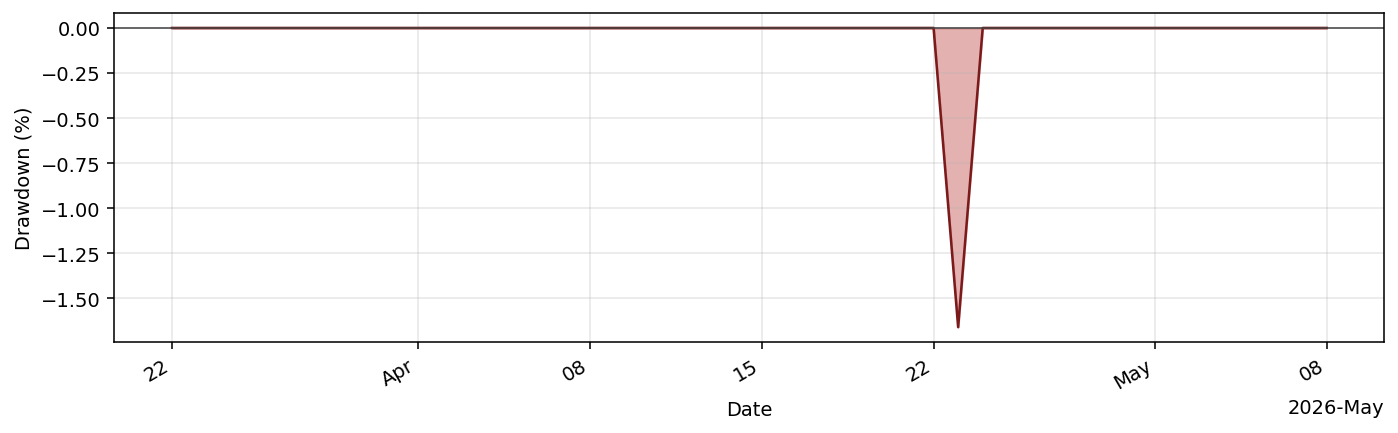
Drawdown profile
Underwater curve — percentage below the running high-water mark. Institutional allocators read this before the equity curve.
Current holdings
| Symbol | Quantity |
|---|---|
| TQQQ | 166.0854 |
| USD | 0.0000 |
Research & documentation
- Strategy deep-dive: RecursiveDecayHarvestBot: strategy deep-dive & live performance
- Reference implementation:
tradingbot/recursivedecayharvestbot.py - Framework: python_tradingbot_framework (open source, fully inspectable)
Related strategies
Other strategies in the Portfolio optimisation family:
- SharpePortfolioOptWeeklyBot · research note- SynthesizedHyperConvexityBot · research note Or view the full strategy roster.
For professional investors
Request the investor deck, DDQ, and extended analytics. Firm-gated and reviewed manually.
Request access